This past winter (2020-2021) a bout of Achilles tendinitis and a fairly serious flare of my ulcerative colitis forced me to take about six weeks off from running. I’m very far from a professional runner, and in someways far even from a “serious” hobby runner, but this is the longest stretch of time when I haven’t run at all in about 16 years. I decided that since I’m getting older, but still have quite a few running goals, now would be a good time for some coaching. I’m now working with the awesome Ryan Miller to build back better and smarter. A major part of the (re-)build period is lots of “easy” running. Easy running should be well below one’s anaerobic, or lactate, threshold. My watch, a Garmin Forerunner 245, tracks my heart rate while running, and then both Garmin Connect and Strava will give me a sense for how much of my run was below threshold. But the optical HR monitors do have some inaccuracies - e.g., see this study or this other study. So an alternative is to track “perceived effort”, and the advice I’ve gotten is that easy is when you can maintain a conversation.
And this all brings me to the analysis for this post. I run a mix of trails, carriage roads, and bike paths. I’m always slower on trails, but I often find my perceived effort greater on trails. With all the ups and downs, steeper grades, and obstacle avoidance, I just seem to be breathing harder (as measured by how often my cheeks are puffed up!). But I every time I finish a trail run lately, I’m surprised by my HR data. So I decided to plot it out to see what’s going on.
I got the data for this analysis by exporting my recent running data using Garmin Connect. I’m filtering it so I’m only using data after my recent break. I also added a column to note trail vs road/carriage road (i.e., gravel) runs. This last bit was done manually, since I don’t track these precisely enough.
library(tidyverse)
library(lubridate)

running <- read_csv("running_winter21.csv")
running$Date_Smpl <- as_date(running$Date)
running$`Avg HR` <- as.numeric(running$`Avg HR`)

running_new <- filter(running, Date_Smpl > "2021-01-25")
running_new$Trail <- c("trail", "trail", "road_gravel", "road_gravel", "road_gravel",
                       "trail", "road_gravel", "trail", "road_gravel", "road_gravel",
                       "road_gravel", "road_gravel", "trail", "road_gravel", "road_gravel",
                       "trail", "road_gravel", "trail", "trail")
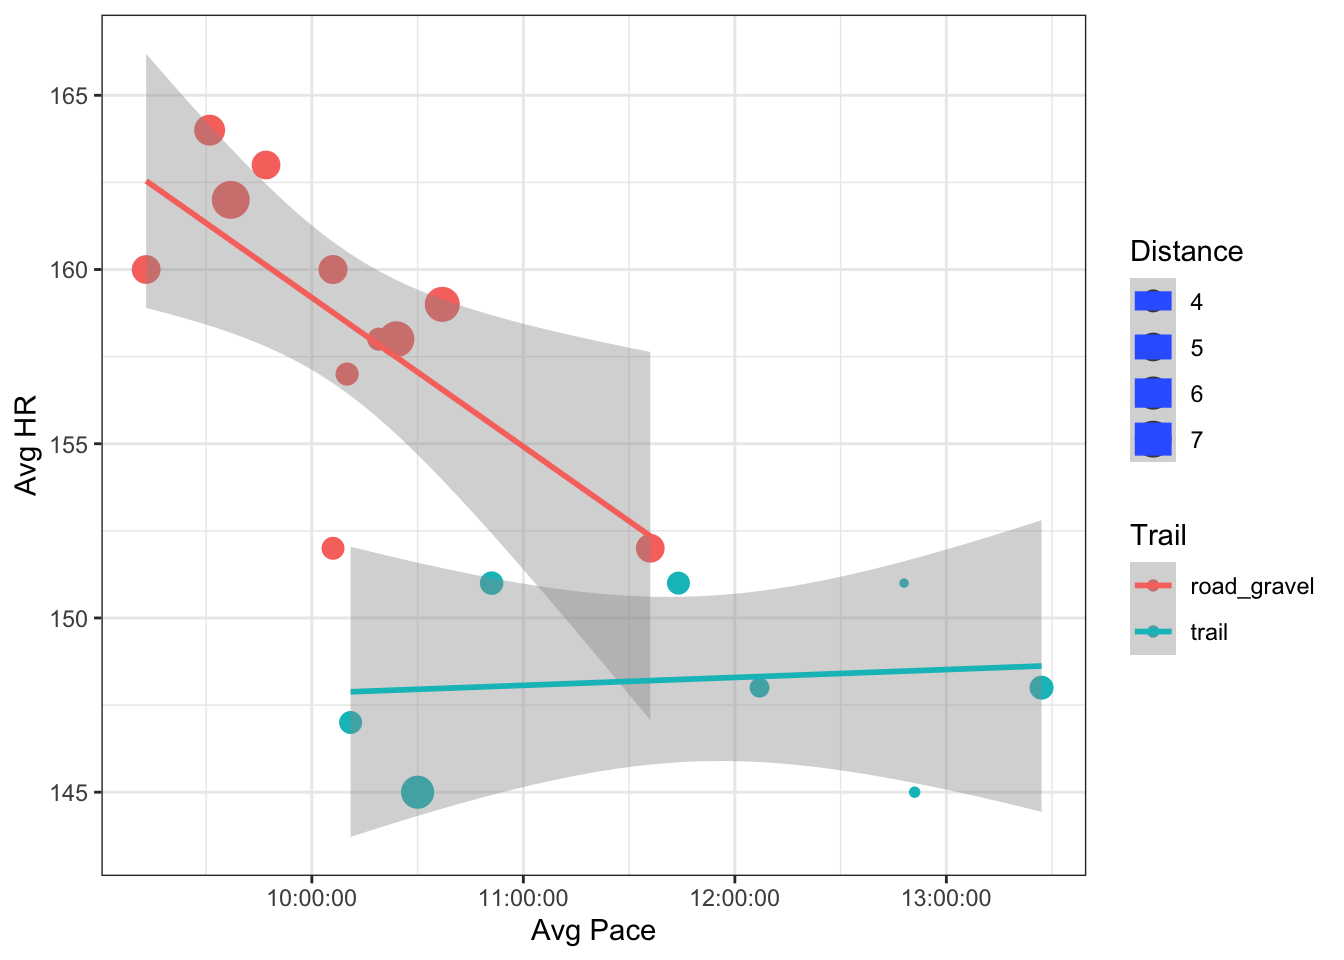
Below is an x-y scatter plot of my average heart rate during a run (Avg HR) versus my average pace (Avg Pace), separated by whether the run was a trail run or a road/gravel run.
I also added distance of the run using the size of the point (bigger points, longer runs).
A few things that really strike me here:
- On even surfaces (roads / carriage roads), there is a very clear relationship between my average HR and my pace. I get faster and my HR goes up. I think that makes sense; kinda what one would expect.
- Trail runs are slower. I already knew this, but here’s further evidence.
There isn’t much of a relationship between HR and pace on the trails. Wait, what? Why’s that?
run_plot <-
ggplot(data = running_new, aes(x = `Avg Pace`, y = `Avg HR`, colour = Trail, size = Distance)) +
geom_point() +
geom_smooth(method = "lm") +
theme_bw()
run_plot
## `geom_smooth()` using formula 'y ~ x'
For fun, I also ran a linear regression (actually an ANCOVA, of sorts). Nothing surprising here. Significant effect of pace and run-type on heart rate, and an interaction between those two variables (i.e., a change in the slope of the HR ~ pace line based on run-type).
running_lm <- lm(`Avg HR` ~ `Avg Pace` * Trail, data = running_new)
summary(running_lm)
##
## Call:
## lm(formula = `Avg HR` ~ `Avg Pace` * Trail, data = running_new)
##
## Residuals:
##     Min      1Q  Median      3Q     Max
## -6.7660 -1.1811  0.1606  2.4847  2.9676
##
## Coefficients:
##                         Estimate Std. Error t value Pr(>|t|)
## (Intercept)            2.020e+02  1.443e+01  13.992 5.16e-10 ***
## `Avg Pace`            -1.188e-03  3.951e-04  -3.007  0.00885 **
## Trailtrail            -5.638e+01  1.799e+01  -3.134  0.00682 **
## `Avg Pace`:Trailtrail  1.251e-03  4.683e-04   2.671  0.01743 *
## ---
## Signif. codes:  0 '***' 0.001 '**' 0.01 '*' 0.05 '.' 0.1 ' ' 1
##
## Residual standard error: 2.881 on 15 degrees of freedom
## Multiple R-squared:  0.8221,	Adjusted R-squared:  0.7865
## F-statistic:  23.1 on 3 and 15 DF,  p-value: 7.087e-06
Final thoughts and conclusions
So why do I perceive trail runs as more effort but my heart rate data suggest that they are “easier” runs? I’m really not sure. It could be that even though those short, steep up hills and obstacle avoidance maneuvers on the trail cause me to breath harder, I recover quickly by running nice and slowly for most of the rest of the run. Perhaps being more engaged with the terrain makes me think I’m working harder, while on the carriage roads I just tend to day-dream?
Perhaps the most surprising result here is that there doesn’t appear to be a relationship between pace and HR on my trail runs. That’s weird, but here’s one thought - it could be that even my faster trail pace is slow enough to be “easy(-ish)”.
I’ll close this post with a caveat. As I said, I took about six weeks off before collecting these data. During the past four weeks of running again, my fitness is probably (I hope!) improving. So there’s a temporal component I’m not considering in these data. As always, I’ll keep collecting these data, and perhaps will return to them again down the line.